Lets load the dataset
1
2
3
4
5
6
7
8
9
10
11
12
import pandas as pd
import seaborn as sns

df = sns.load_dataset('tips')
df.head()

total_bill	tip	sex	smoker	day	time	size
0	16.99	1.01	Female	No	Sun	Dinner	2
1	10.34	1.66	Male	No	Sun	Dinner	3
2	21.01	3.50	Male	No	Sun	Dinner	3
3	23.68	3.31	Male	No	Sun	Dinner	2
4	24.59	3.61	Female	No	Sun	Dinner	4
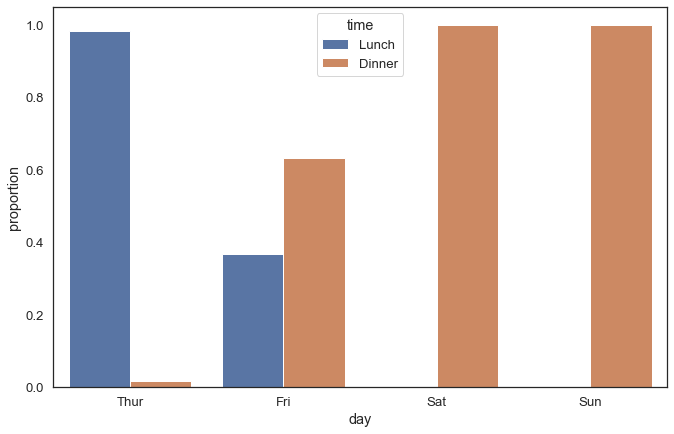
Lets say we want to distinguish the peoples preference for lucnch or dinner based on days. We can do that combining the pandas with seaborn
1
df['time'].groupby(df['day']).value_counts(normalize=True).rename('proportion').reset_index().set_axis(['day','time','proportion'], axis=1).pipe((sns.barplot,'data'),x='day',y='proportion',hue='time')