
To generate a motif logo first we need to create a count table for the nucleotide bases from fasta sequences and then information matrix to plot motif logo
Create count table from fasta sequence
1
2
3
4
5
6
7
8
9
10
11
12
13
14
15
16
17
18
19
20
21
22
23
24
25
26
27
28
29
30
31
32

import logomaker
import pandas as pd
from Bio.Seq import Seq
from Bio import motifs
import matplotlib.pyplot as plt
import seaborn as sns

seq_list = []

fasta = open(input_fasta_file,'r').readlines()

for line in fasta:
    if not line.startswith('>'):
			seq_list.append(line.upper().replace('\n',''))

	print('...... getting base counts .....\n')

	instances = [Seq(x.upper()) for x in seq_list]
	m = motifs.create(instances)

	m_df = pd.DataFrame(m.counts)
    m_df = m_df.iloc[0:10,:]
    m_df.head()

# Running above for loop gives following output
    A	C	G	T
0	239	239	351	593
1	513	231	211	467
2	281	140	771	230
3	284	451	443	244
4	410	621	156	235
Generate information matrix to generate motif logo
1
2
3
4
5
6
7
8
9
10
11
12
13
t_df = logomaker.transform_matrix(m_df, from_type = 'counts', to_type='information')
sns.set(font_scale=1.5, style='white')
plt.figure(figsize=(15,15))
crp_logo=logomaker.Logo(t_df,font_name='Arial Rounded MT Bold')
crp_logo.style_spines(visible=False)
crp_logo.style_spines(spines=['left', 'bottom'], visible=True)
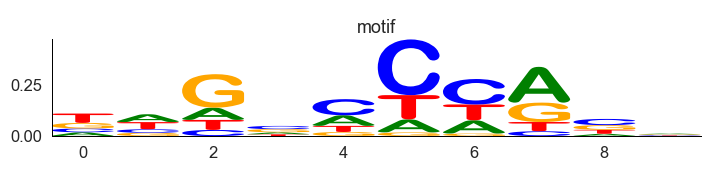
plt.title('motif')
plt.tight_layout()
plt.savefig('/Users/dshresth/Downloads/test.pdf')
Please make sure you have required packages for this to work. I also have the script here.