
If you want to include multiple plots in a single figure, you can do that by creating axes. Here, is the sample code for that.
In this section of code I am just loading the example dataset.
1
2
3
4
5
6
7
8
9
10
11
12
13
14
15
16
17
import searborn as sns
import matplotlib
import matplotlib.pyplot as plt
matplotlib.rcParams['pdf.fonttype'] = 42
matplotlib.rcParams['ps.fonttype'] = 42


data = sns.load_dataset('tips')
tips.head()

total_bill	tip	sex	smoker	day	time	size
0	16.99	1.01	Female	No	Sun	Dinner	2
1	10.34	1.66	Male	No	Sun	Dinner	3
2	21.01	3.50	Male	No	Sun	Dinner	3
3	23.68	3.31	Male	No	Sun	Dinner	2
4	24.59	3.61	Female	No	Sun	Dinner	4
After loading the data you can use following code for subplots
1
2
3
4
5
6
7
8
9
10
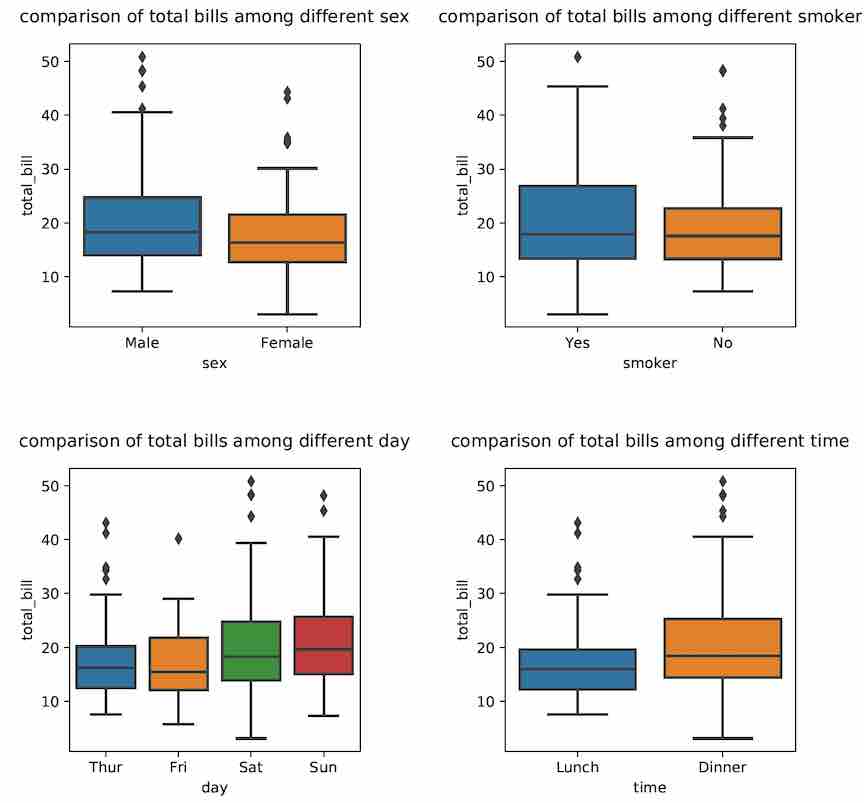
cols = ['sex','smoker','day', 'time']
fig, axes = plt.subplots(nrows=2, ncols=2, figsize=(10,10))
fig.subplots_adjust(wspace=0.5, hspace=0.5)
for ax, x in zip(axes.flatten(), cols):
sns.boxplot(x=x, ax=ax, y='total_bill', data =tips)
ax.set_title(f'comparison of total bills among different {x}', pad=15)
plt.savefig('/your/path/plot.pdf')
In the above code, wspace and hspace adjusts the space between plots and pad set the space between the subplot title and plot. You should be getting the image shown below.
You can also use:
1
2
3
4
5
6
7
8
9
10
11
plt.subplot(num_row, num_column, figure1)
sns.boxplot()

plt.subplot(num_row, num_column, figure2)
sns.boxplot()

plt.subplot(num_row, num_column, figure3)
sns.boxplot()

plt.subplot(num_row, num_column, figure4)
sns.boxplot()