Here I will show how to add frequency count to the each category in the box plot. For this we will use the searborn provided example dataset.
First, lets load the dataset:
1
2
3
4
5
6
7
8
9
10
11
12
13
14
15
16
17
import searborn as sns
import numpy as np
import matplotlib
import matplotlib.pyplot as plt
matplotlib.rcParams['pdf.fonttype'] = 42
matplotlib.rcParams['ps.fonttype'] = 42

data = sns.load_dataset('tips')
tips.head()

total_bill	tip	sex	smoker	day	time	size
0	16.99	1.01	Female	No	Sun	Dinner	2
1	10.34	1.66	Male	No	Sun	Dinner	3
2	21.01	3.50	Male	No	Sun	Dinner	3
3	23.68	3.31	Male	No	Sun	Dinner	2
4	24.59	3.61	Female	No	Sun	Dinner	4
After that, lets create two separate functions to get the all the annotation informations.
1
2
3
4
5
6
7
8
9
10
11
12
13
14
15
16
17
18
19
20
21
22
23
24
25
26
27
28
29
30
31
32
33
34
35
36
37
def hue_annotation_counts(df, label, yaxis_val, hue_label, order=None, hue_order=None):

    if order==None:
        order = list(df[label].unique())
    if hue_order == None:
        hue_order = list(df[hue_label].unique())
    width=0.8

    n_levels = len(df[hue_label].unique())
    each_width = width / n_levels
    offsets = np.linspace(0, width - each_width, n_levels)
    offsets -= offsets.mean()

    pos = [x+o for x in np.arange(len(order)) for o in offsets]

    counts = df.groupby([label,hue_label])[yaxis_val].size()

    counts = counts.reindex(pd.MultiIndex.from_product([order, hue_order ]))

    medians = df.groupby([label,hue_label])[yaxis_val].median()
    medians = medians.reindex(pd.MultiIndex.from_product([order, hue_order]))

    return pos, counts, medians, order, hue_order


def label_annotation_counts(df, label, yaxis_val, order=None):

    if order==None:
        order = list(df[label].unique())

    counts = df.groupby(label)[yaxis_val].size()
    counts = counts.reindex(index=order)

    medians = df.groupby(label)[yaxis_val].median()
    medians = medians.reindex(index=order)

    return range(len(counts)), counts, medians, order
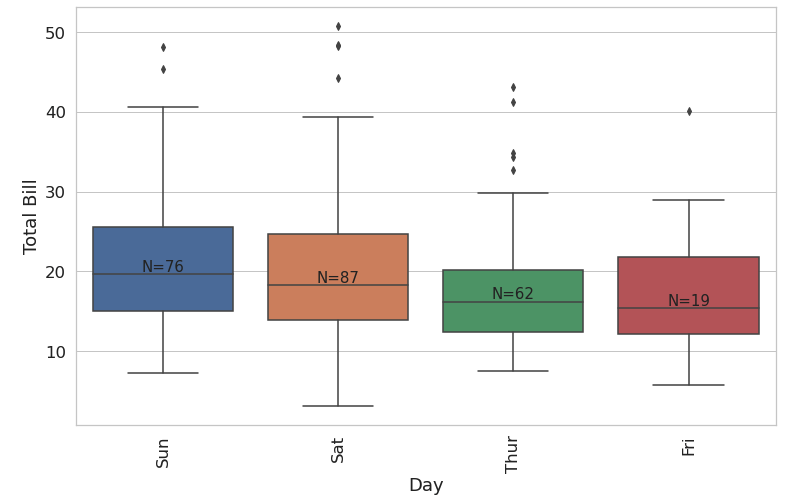
Now, plotting boxplots without hue information:
1
2
3
4
5
6
7
8
9
10
11
12
13
14
plt.figure(figsize=(11,7))

pos, counts, medians, order = label_annotation_counts(temp, 'day','total_bill', order)

sns.boxplot(x = 'day', y='total_bill',data= temp, order=order)

for p,n,m in zip(pos,counts,medians):
    if not np.isnan(m):
        plt.annotate('N={:.0f}'.format(n), xy=(p, m), xycoords='data', ha='center', va='bottom', size=15)

plt.tight_layout()
plt.ylabel('Total Bill')
plt.xlabel('Day')
plt.xticks(rotation=90)
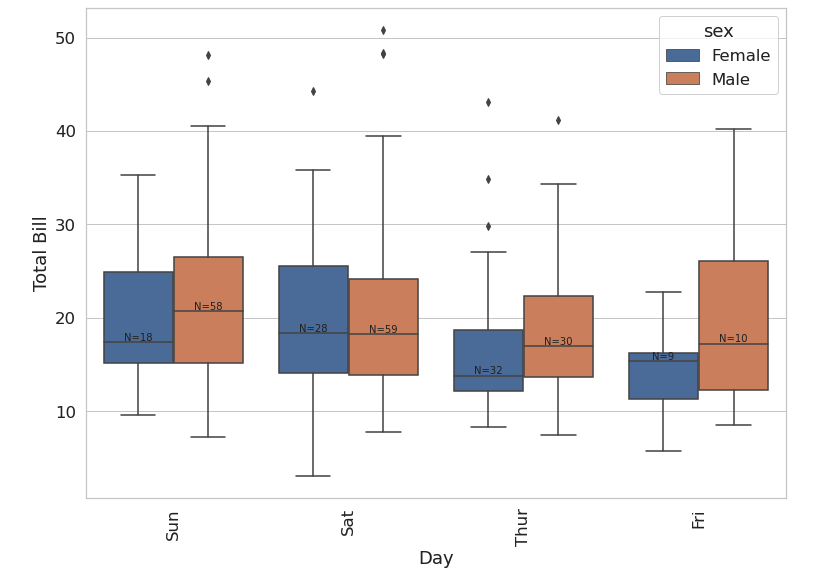
Now, plotting boxplots with extra information (‘sex’), which sub-divides x-label into further two categories. If you have your own order and hue order, you can pass that while calling the function.
1
2
3
4
5
6
7
8
9
10
11
12
plt.figure(figsize=(11,8))

pos, counts, medians, order, hue_order = hue_annotation_counts(temp, 'day','total_bill','sex')

sns.boxplot(x = 'day', y='total_bill',hue = 'sex',data= temp, order=order, hue_order=hue_order)

for p,n,m in zip(pos,counts,medians):
    if not np.isnan(m):
        plt.annotate('N={:.0f}'.format(n), xy=(p, m), xycoords='data', ha='center', va='bottom', size=10)

plt.tight_layout()
plt.xticks(rotation=90)